 Council on Foreign Relations
Council on Foreign Relations
2018–2019
Ideas to shape a healthier world
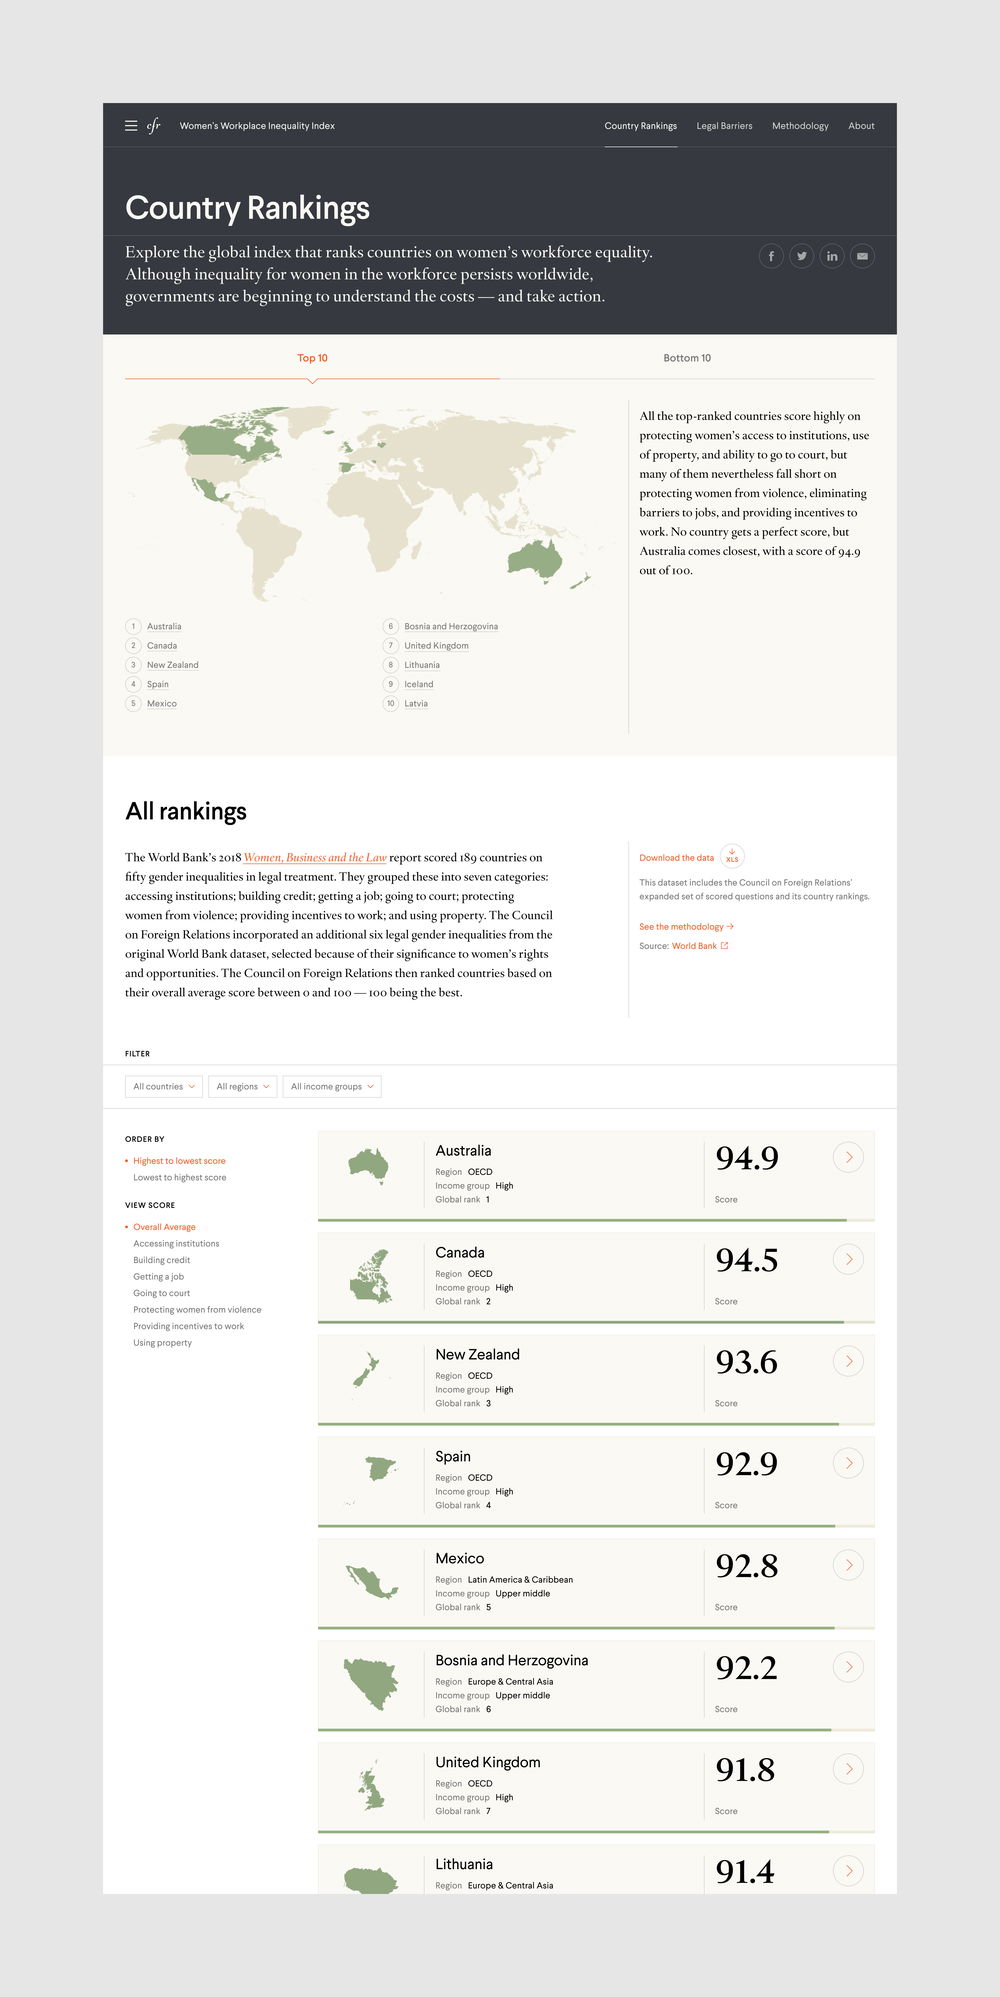
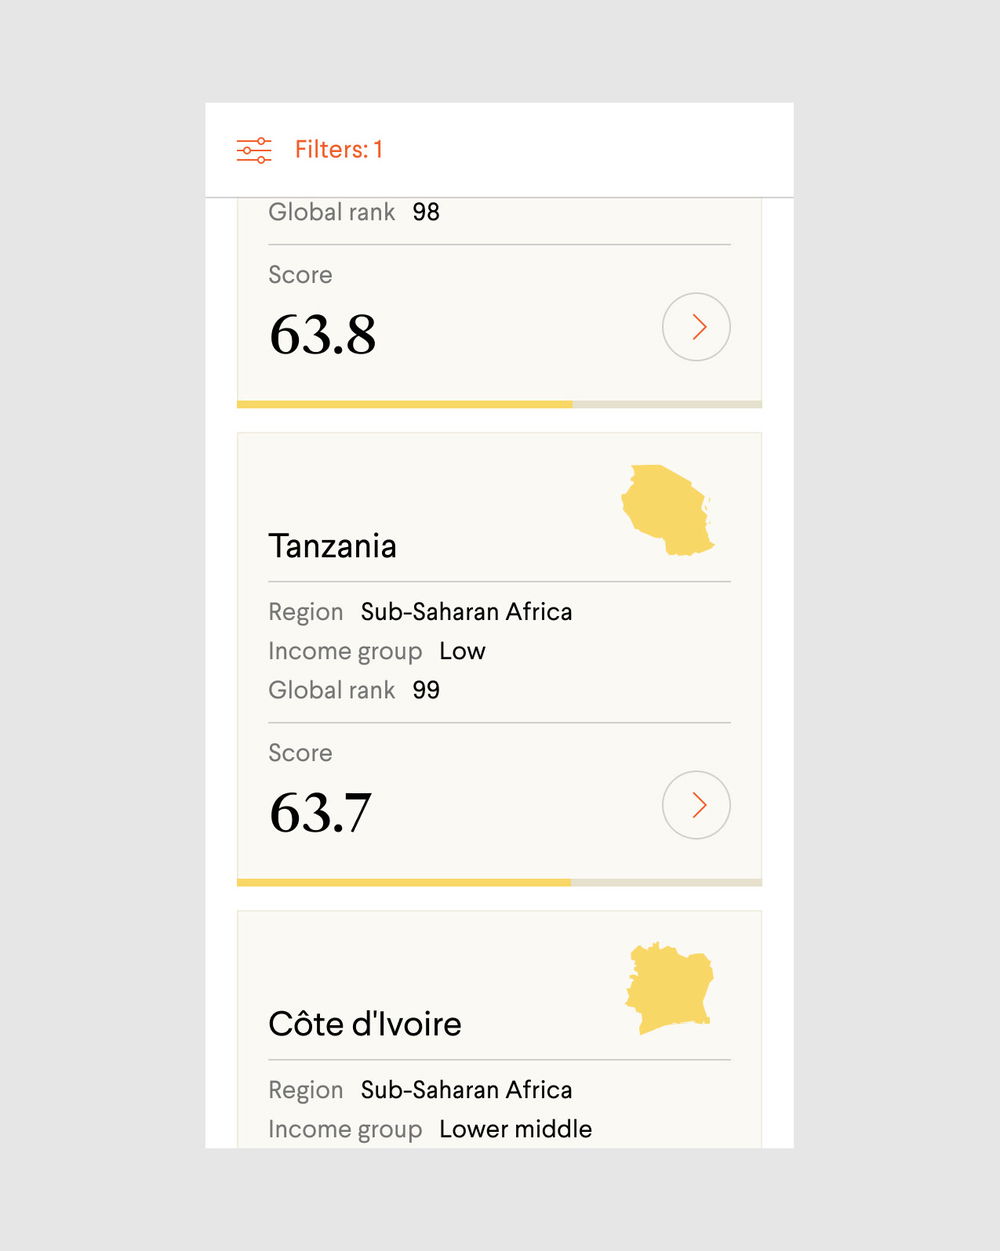
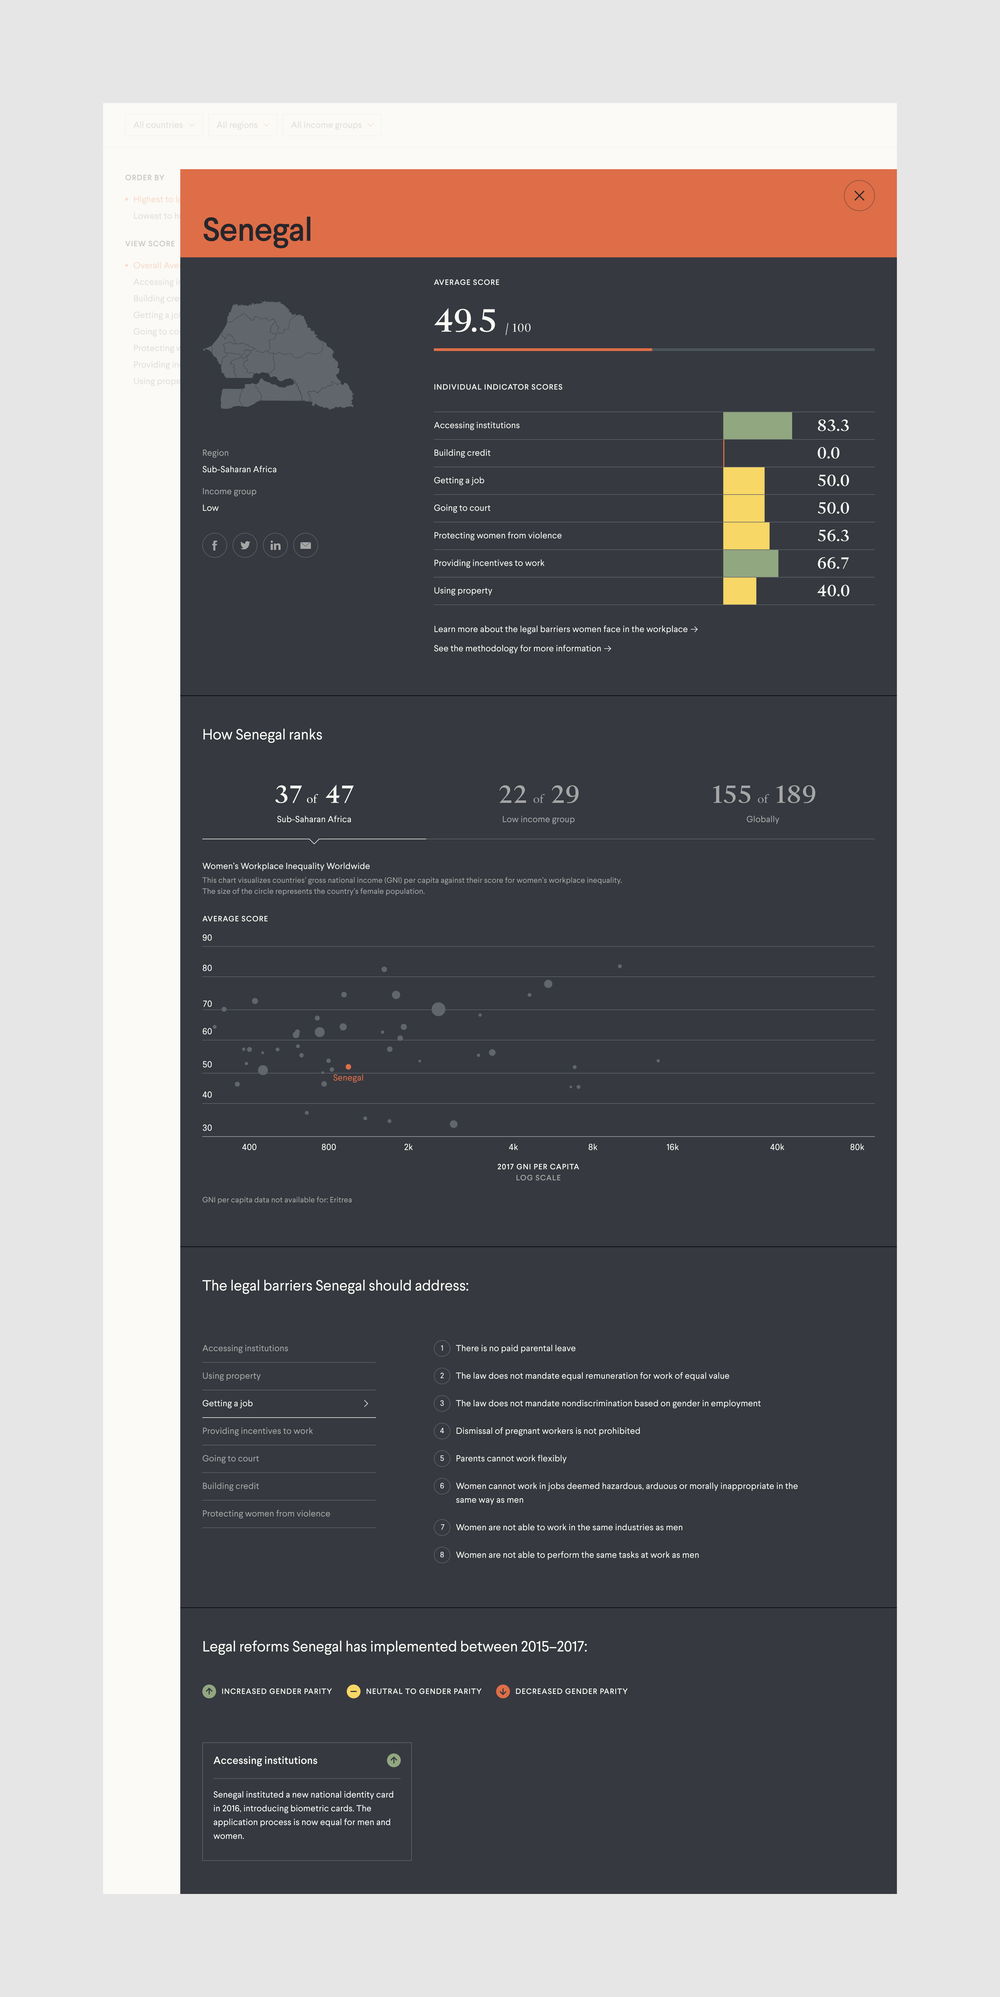
CFR Legal Barriers website
In recent years, the positive relationship between women’s economic empowerment and the success of a country’s economy has become more widely understood. Despite an increased awareness that with greater gender equality comes greater national prosperity, many countries still limit and undervalue women’s work and participation in the labor force.
We partnered with the Women and Foreign Policy (WFP) program at the Council on Foreign Relations on a second project that sought to dig deeper into the legal barriers and obstacles women face when attempting to enter the workforce. The resulting collaboration offers users an immersive overview of the global breadth and scale of inequality as well as a deep dive into how countries rank in the effort to eradicate these barriers worldwide.
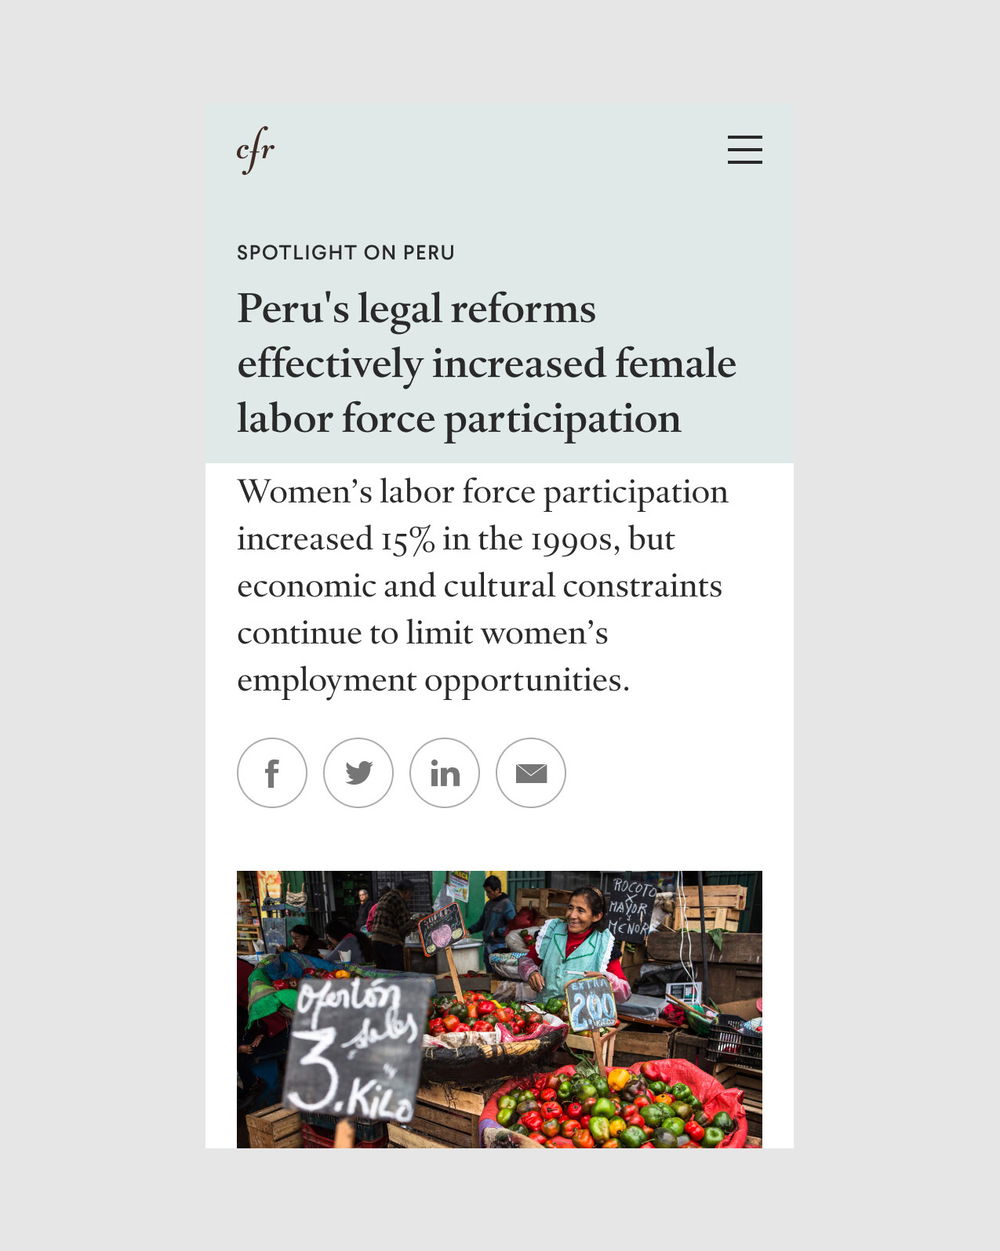
CFR Women’s Economic Participation website
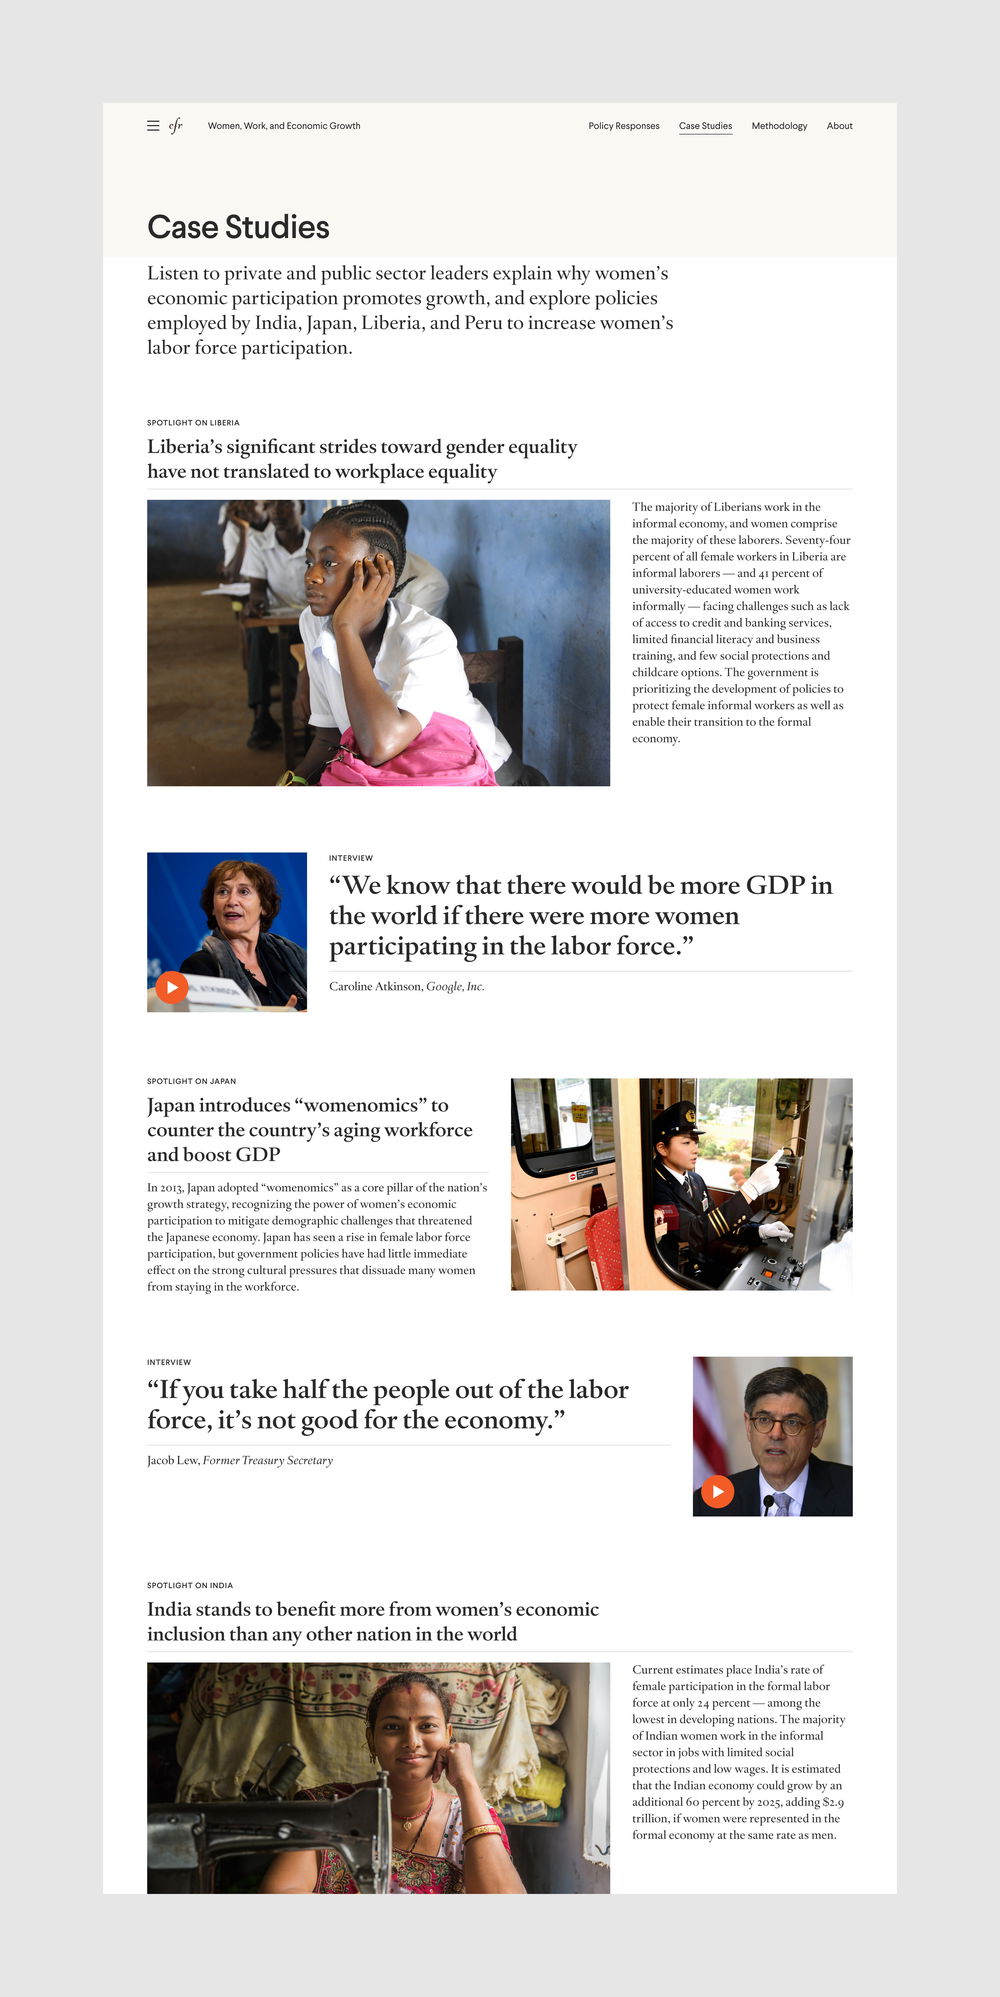
With greater gender equality the global economy would look radically different – just how different and what it would take to get there was the focus of our collaboration with The Women and Foreign Policy program at the Council on Foreign Relations.
Building on a report by the McKinsey Global Institute, we developed a data-rich interactive that offers policy and economic leaders a clear picture of the positive relationship between women’s economic participation and GDP growth. Blending quantitative data with editorial narrative, we aimed to inform political discourse and inspire action towards a more inclusive and ultimately prosperous global economy.


CFR Think Global Health website
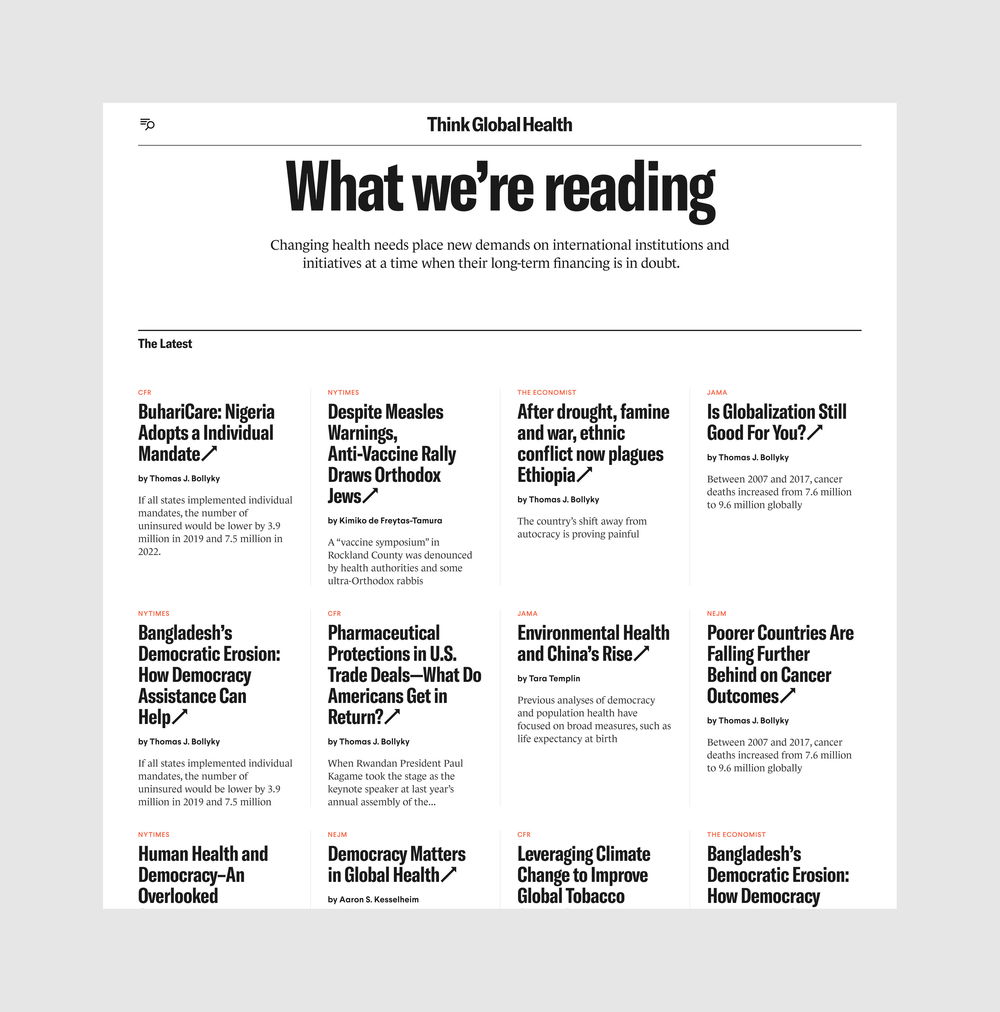
In today’s nonstop media landscape it can be difficult to understand the larger forces and systems shaping the world. Think Global Health – a new blog from the Council on Foreign Relations – aims to look beyond the daily news cycle to expose how changes in global health are interacting with and impacting nearly every major contemporary issue. From urbanization to migration, the environment to the economy, there is almost no aspect of our lives that isn’t deeply influenced by trends in global health.
Through close collaboration, we crafted a smart, accessible, and compelling editorial experience that could inspire readers to see the world through the lens of global health. Our new publishing platform helps realize this vision through a design language that is radically elegant – allowing the content to shine – and a flexible modular system that can grow with the site over time.

- Brand
- Visual and verbal identity
- Experience
- Research and analysis
- Experience vision and strategy
- Concepting and prototyping
- Experience design
- Design systems
- Technology
- Technology strategy and architecture
- Custom application development
- Custom interface development
- Analytics and optimization

